Tricks with Boolean Series
This notebook discusses Boolean series, and various useful things you can do with them.
First let’s import our libraries:
import pandas as pd
import numpy as np
rng = np.random.default_rng(20201103)
Computing Probability
If we have a logical series:
xb = pd.Series([True, False, True, True, True, False, False, True, False, True])
xb
0     True
1    False
2     True
3     True
4     True
5    False
6    False
7     True
8    False
9     True
dtype: bool
We can count the number of True values with sum:
xb.sum()
6
We can count the fraction of True values, or the probability of True, with mean():
xb.mean()
0.6
The NumPy equivalents also work:
np.mean(xb)
0.6
Creating with Logical Operations
If you do a logical operation (==, <, >, <=, or >=) on a series, comparing it to either a fixed value or another series, you will get a Boolean series.
This is very useful for creating the outcome vector for a logistic regression, as the boolean series will be treated as 1 (True) and 0 (False), and can be predicted with either StatsModels or SciKit-Learn’s logistic regression or other classifier.
For example, if we draw some random numbers:
xs = pd.Series(rng.random(size=1000))
xs
0      0.163352
1      0.333021
2      0.054169
3      0.662442
4      0.517284
         ...
995    0.882045
996    0.897472
997    0.161948
998    0.850922
999    0.222618
Length: 1000, dtype: float64
xs.hist()
<matplotlib.axes._subplots.AxesSubplot at 0x22e1f5277f0>
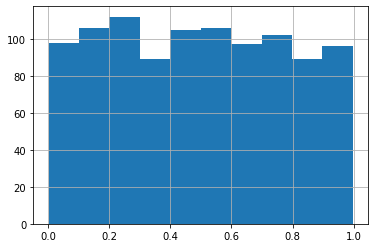
xs.describe()
count    1000.000000
mean        0.491382
std         0.285871
min         0.000805
25%         0.235146
50%         0.489305
75%         0.737922
max         0.997661
dtype: float64
We can get a series that is True when the number is at least 0.8:
xs_ge = xs >= 0.8
xs_ge
0      False
1      False
2      False
3      False
4      False
       ...
995     True
996     True
997    False
998     True
999    False
Length: 1000, dtype: bool
We can verify that values start at 0.8:
xs[xs_ge].min()
0.8050954039782324
Since the values are drawn uniformly in the range \([0,1)\), then approximately 20% of the values should be at least 0.8 (\(P(X \ge 0.8) = 0.2\)). Let’s check:
xs_ge.mean()
0.183
Logical Operations
The bitwise negation operator, ~, negates a boolean series:
~xb
0    False
1     True
2    False
3    False
4    False
5     True
6     True
7    False
8     True
9    False
dtype: bool
The np.logical_not function also does:
np.logical_not(xb)
0    False
1     True
2    False
3    False
4    False
5     True
6     True
7    False
8     True
9    False
dtype: bool
We can combine them with bitwise and (&) or or (|).
Let’s find all the values between 0.8 and 0.9:
xs_in_range = xs_ge & (xs < 0.9)
xs[xs_in_range].describe()
count    87.000000
mean      0.849424
std       0.028517
min       0.805095
25%       0.826880
50%       0.845260
75%       0.878704
max       0.897472
dtype: float64
We can find everything except \([0.2,0.8)\):
xs_lohi = xs_ge | (xs < 0.2)
xs[xs_lohi].hist()
<matplotlib.axes._subplots.AxesSubplot at 0x22e1edadeb0>
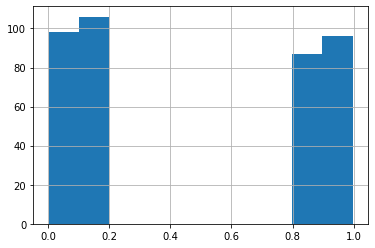
Look, we cut out the middle!